Map View
PremiumTurn any Dynamics 365 model-driven view or subgrid into an interactive map - color-coded pins, clustering, and a live legend.
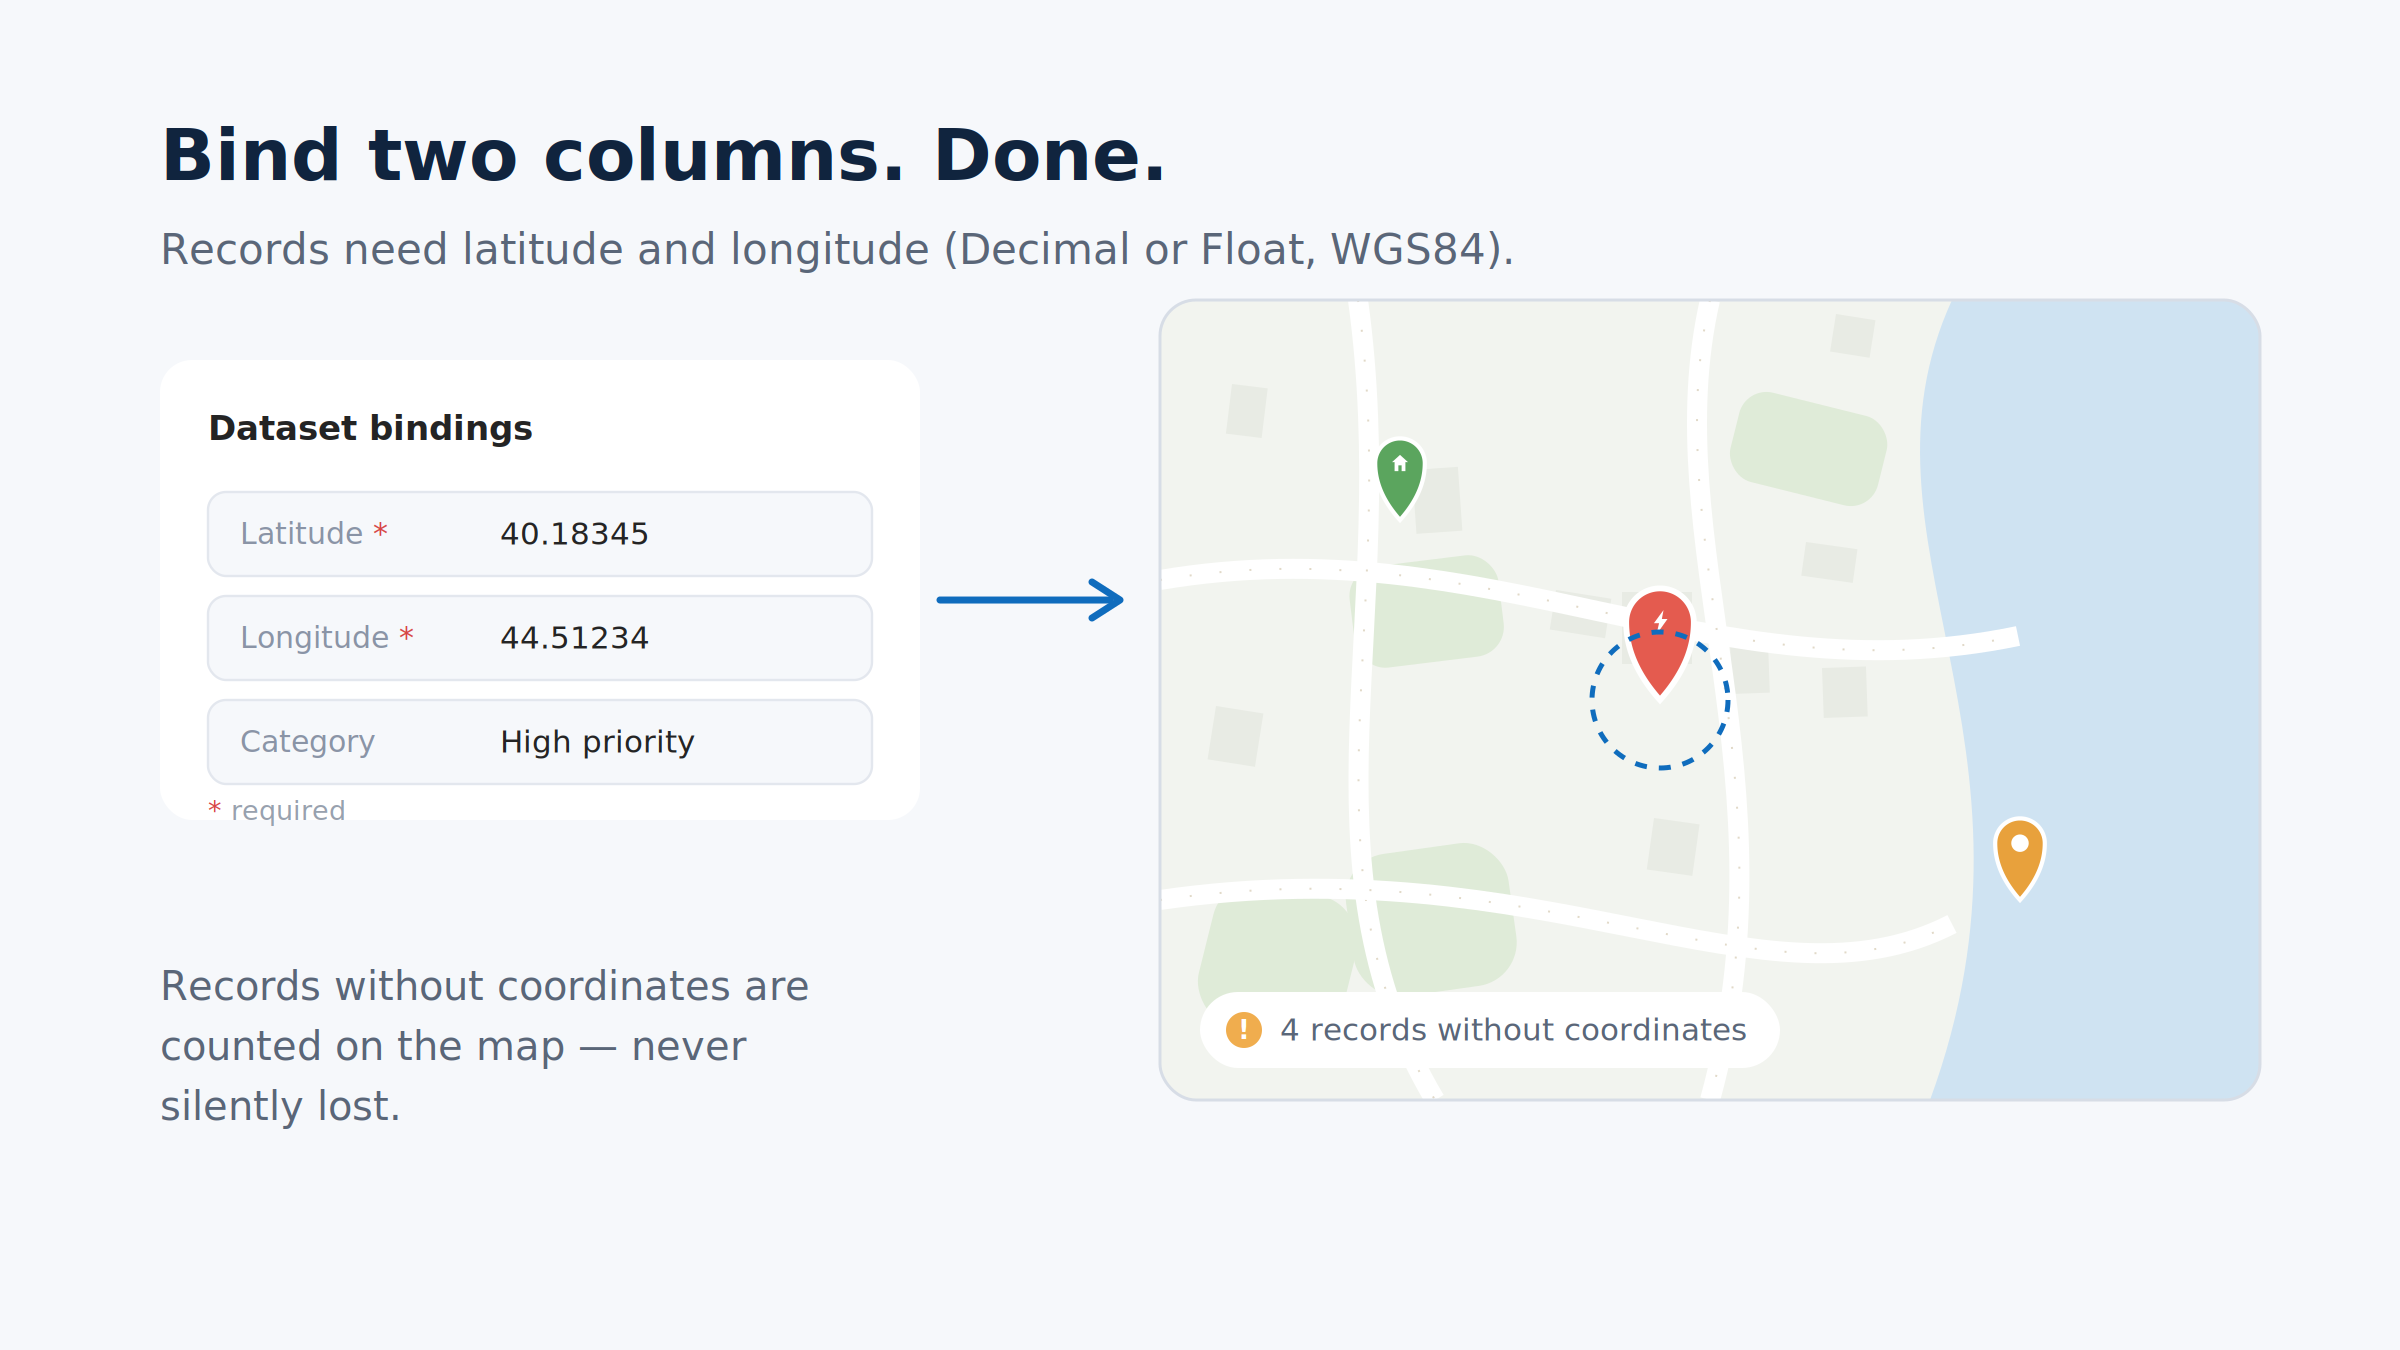
Solzet Map View is a Premium dataset PCF control that shows the records of any Dynamics 365 model-driven view or subgrid as markers on an interactive Leaflet map. Bind a latitude and a longitude column (Decimal or Float) on any table and every record becomes a pin. Pins are colored by any choice, text or numeric column through one JSON color rules property, dense areas cluster and split apart as you zoom, and a legend filters the map live. Clicking a pin opens a record card with an Open action. The map follows the selected view and runs on web, tablet and the Field Service mobile app. It is a licensed control; contact us for licensing.
What does Map View do?
Dynamics 365 stores latitude and longitude on assets, functional locations, work orders, and countless custom tables - then shows them to you as rows in a grid, with the only real map locked inside the schedule board. Solzet MapView is a dataset PCF control that closes that gap: bind a latitude and a longitude column (Decimal or Float) on any view or subgrid of any table and every record becomes a marker on an interactive Leaflet map. Pins are colored by any Choice, text, or numeric column through a single JSON color-rules property - discrete values or numeric threshold bands - with optional glyphs such as bolt, wrench, warning, or building. Dense areas collapse into cluster bubbles that split apart as you zoom, a legend filters the map live, and clicking a pin opens a record card with real column display names, formatted values, and an Open action that launches the record in a new window so users never lose the map. The map follows the selected view - system views, personal views, filtered subgrids - and runs on web, tablet, and the Field Service mobile app. No plugins, no companion services, no per-record configuration: bind two columns and you have a map.
What problems does Map View solve?
MapView solves the spatial blind spots of model-driven apps:
- Maps are locked in the schedule board: asset managers, service managers, and field technicians never see their records spatially - MapView puts the map where the records already are, on a view, a dashboard, or a parent record's subgrid
- Location data stays invisible: customer assets and functional locations carry coordinates nobody ever looks at - on a map, coverage gaps, regional density, and misplaced records become obvious in seconds
- Status lives in a column, not on the map: conditional coloring by any Choice, text, or numeric column - including numeric bands such as < 10 kV, 10-110 kV and > 110 kV - makes the answer visible at a glance
- Grids hide the big picture: 500 records in one city and 3 in another look identical in a list, while smart clustering shows the real distribution and splits apart as you zoom in
- Filtering means exporting to Excel: the built-in legend filters live with checkbox multi-select, live counts, tri-state select all, and a one-click Only isolation - and the map always respects the selected view's own filters, personal views included
Where can you use Map View?
What does Map View look like in use?
Browse through screenshots and watch the demo video
Premium control - licensing required
Map View is a commercial, licensed control. Contact us for licensing and pricing for your organization.
What do buyers ask about Map View?
What does Solzet Map View do?
It renders the records of a model-driven view or subgrid as markers on an interactive Leaflet map, using latitude and longitude columns. It puts a map where the records already are, on a view, a dashboard or a parent record's subgrid, rather than only inside the schedule board.
What data does Map View need?
A latitude and a longitude column, Decimal or Float, on the table behind the view or subgrid. There are no plugins, no companion services and no per-record configuration: bind the two columns and the records appear on the map.
Can pins be colored by status or value?
Yes. A single JSON color rules property colors pins by any Choice, text or numeric column, using discrete values or numeric threshold bands, with optional glyphs such as bolt, wrench, warning or building. The legend filters live with checkbox multi-select, live counts, select all and a one-click Only isolation.
Does Map View respect view filters and work on mobile?
Yes. The map follows the selected view, including system views, personal views and filtered subgrids, and runs on web, tablet and the Field Service mobile app. Clicking a pin opens a record card, and its Open action launches the record in a new window so users keep the map.
Is Map View free?
No. Map View is a Premium, licensed control. Contact us through the form on this page or the licensing button above for licensing for your organization.
Which Solzet services go with Map View?
We recommend the right solution - whether that's Microsoft Dynamics 365, Power Platform, or a custom-built CRM. Some businesses need the Microsoft ecosystem. Others need full control without licensing. We deliver both.
PCF Controls Development - PowerApps Component Framework
PCF controls development for Dynamics 365 and Power Apps in TypeScript and React, with a guide to PCF vs JavaScript, the lifecycle and third party libraries.
Hire a Power Platform Developer or Power Apps Developer
Hire a senior Power Platform developer from Solzet in Yerevan, Armenia: canvas and model-driven Power Apps, Power Pages portals, Power Automate, Dataverse, PCF.
Hire a Dynamics 365 Developer or CRM Developer in Armenia
Hire a senior Dynamics 365 developer or CRM developer from Solzet in Yerevan, Armenia: Dataverse, C# plugins, PCF controls, integrations and project rescue.
Need help implementing Map View?
Tell us how you want to use this control. A senior consultant replies within one business day about installing it, configuring it for your forms, or building a custom PCF control for a requirement it does not cover.